Financial Vulnerability is a Problem: An Economist’s View
Written by Jared Bernstein, Center on Budget and Policy PrioritiesNot every financially healthy family will be in the top percentiles of the income and wealth scales. There is and always will be a distribution of income in our own and similar economic systems, as well as a distribution of opportunity, educational access, and so on. But “financial health” implies that, conditional on reasonable effort, even those households at the low end of that distribution should have a fair shot at the above aspirations.
Much of the policy analysis around financial health reasonably asks how we improve access to opportunities for middle- and low-income families so they can participate in economic expansions in ways that have generally eluded them in recent decades. My questions, however, are different.
I ask: Do improvements in household financial well-being yield benefits to the health and growth of the U.S. economy, and vice versa? The U.S. economy seems stuck in a deeply damaging cycle of bubbles and busts. Are there plausible channels through which financially unstable families interact with an under-regulated finance system that are contributing to that unsettling growth cycle? Is it also possible that financially unhealthy families create a drag on future growth by underinvesting in their children’s ability to contribute to future productivity?
To telegraph the punchline, there is a growing body of research that convincingly links various aspects of financial health to growth. There is, for example, evidence that inequality, income stagnation, and under-regulated finance interact in ways that have led to bubbles and busts that damage the larger economy. Similarly, underinvesting in children’s education and well-being has clear links to diminished health, earnings, and labor supply, all of which have potentially negative growth implications.
Family Financial Health and the Bubble and Bust Cycle
At least the last two recessions were born of financial bubbles. The 1990s expansion ended when the dot-com bubble burst. The 2000s expansion ended with the bursting of the housing bubble, inflated in no small part by “innovative” finance. The Great Recession that followed was particularly deep and costly, in part because it was driven by debt, and particularly housing debt.
This recent pattern of the U.S. business cycle might be the economic shampoo cycle, as in “bubble, bust, repeat.” Figure 1 suggests that the financial health of individual households may well play a role in this shampoo cycle, as families with stagnant incomes lack adequate guidance in financial markets, thus making poor choices with negative long-term consequences.
The schematic begins at the top with increased income inequality, which by definition means that less of the economy’s income growth is reaching middle- and lower-income households, while wealthy households accumulate both income and wealth. Note, for example, that according to Census data, the real median income of nonelderly households has fallen 11 percent since 2000 (more than $7,000 in real 2013 dollars).1
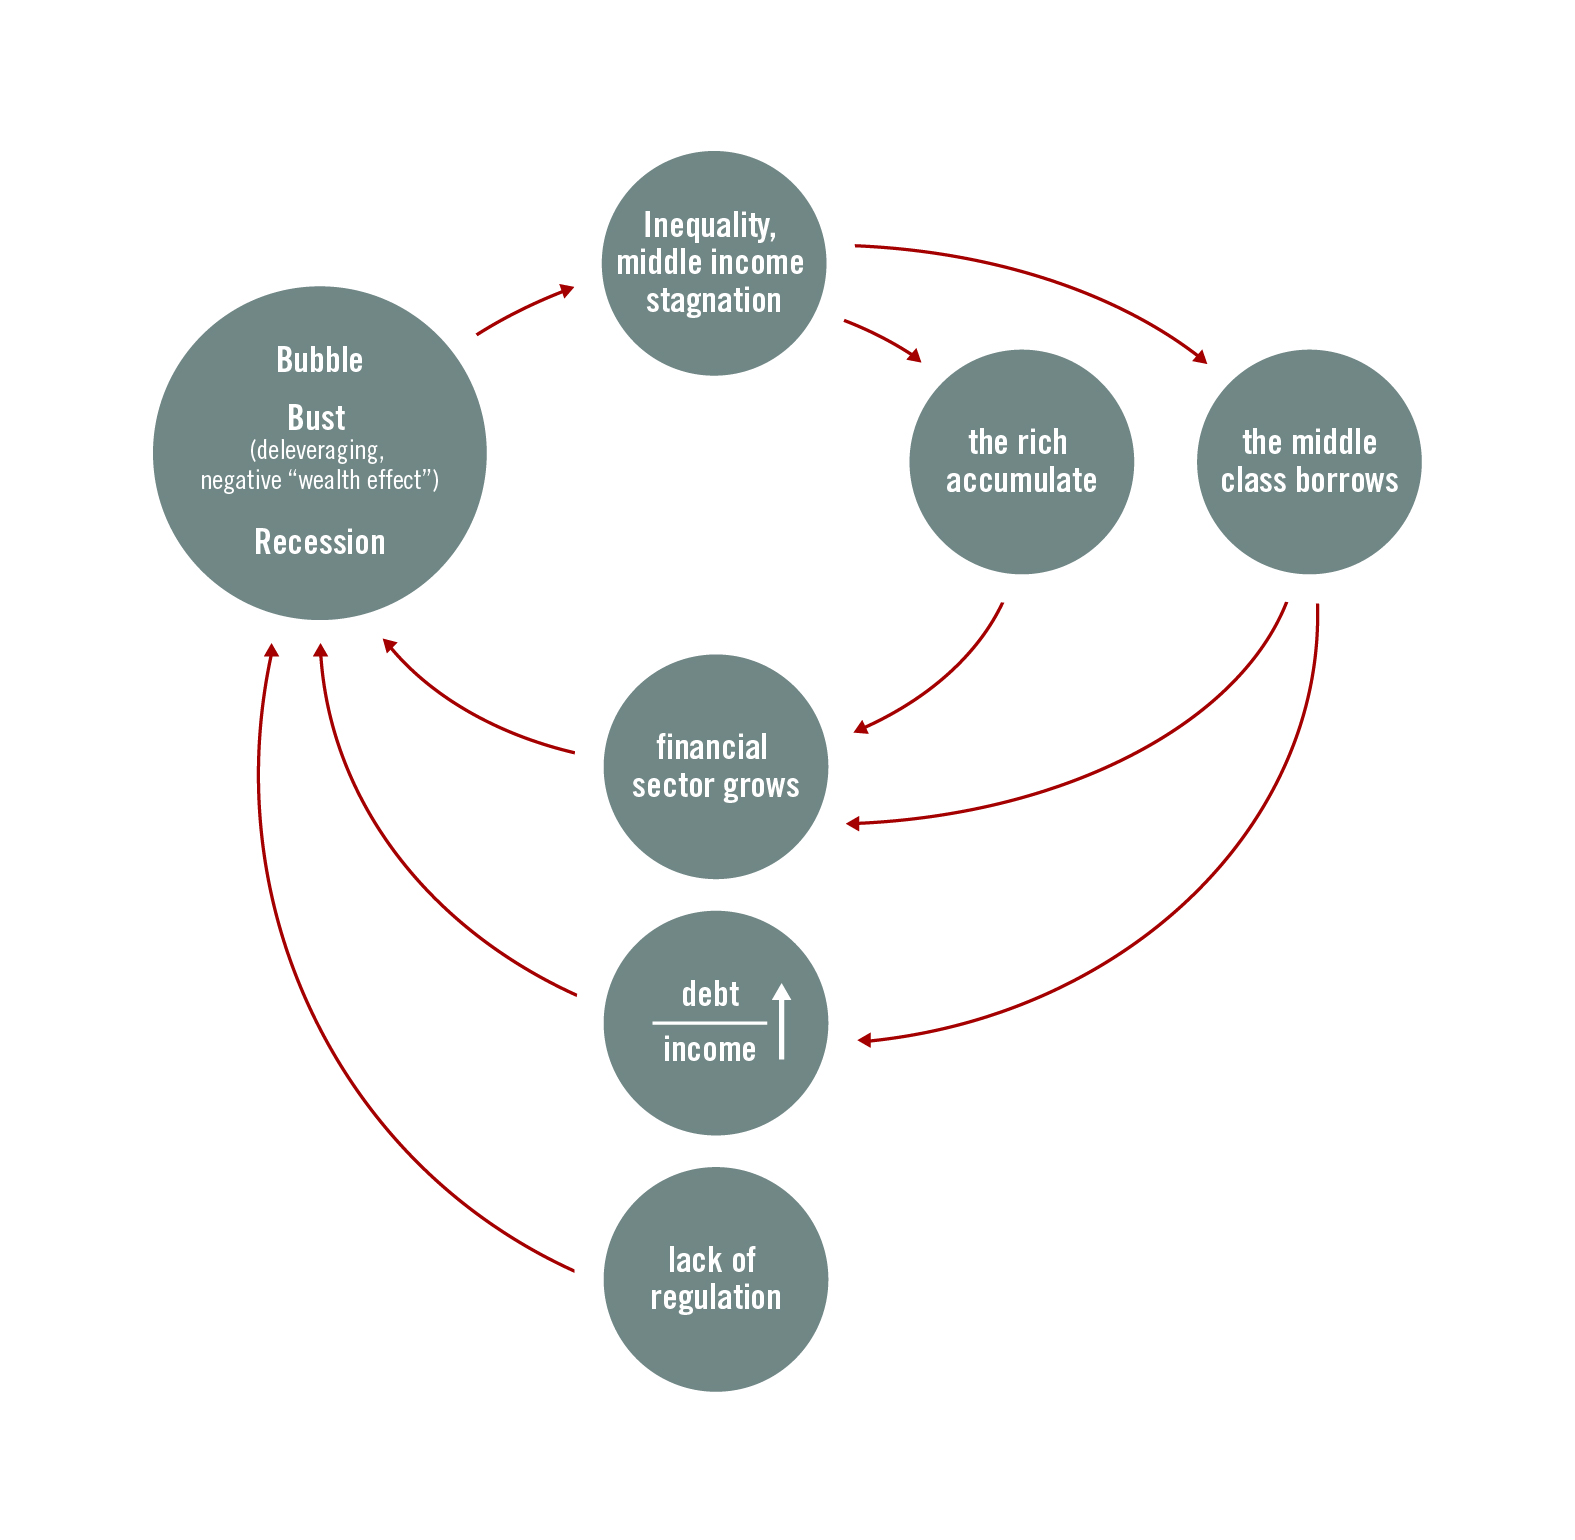
Figure 1
Moving clockwise, this dynamic has two effects. First, given their stagnant/falling incomes and low net worth, low- and moderate-income households turn to credit markets to maintain or improve their living standards. At the same time, wealth accumulates among the top few percent of households, and financial institutions make a large and relatively inexpensive supply of loanable funds available, generating a higher demand for financial intermediation and increasing the size of the financial sector.
At this point, another important dynamic enters the mix, itself a function of high wealth concentration and its disproportionate influence in our politics: the absence of both sufficient financial market oversight and adequate advice or guidance for “low-information” households using credit. This combination of forces is a potent recipe for a dangerous bubble. Financial institutions provide a large supply of loanable funds to a large group of borrowers not supported by much income growth or financial knowledge or guidance. This leads to an increase in the borrowers’ debt-to-income ratio. Meanwhile, an under-regulated financial sector grows, leading to a financial bubble inflated by debt.
Add to this volatile mix the fact that the financial system’s near-term incentives encourage this cycle. In the most recent iteration of the cycle, the ability of financial institutions to securitize and profitably pass off bundles of loans to other investors helped support reckless mortgage lending based on the assumption of ever-inflating house prices, not a borrower’s ability to repay. Leavened by weak oversight and motivated by the ideology that the markets would self-regulate, the sequence inflated a bubble, which burst when home prices could no longer defy gravity. As a result, borrowers aggressively paid down debt, and wealth effects — the extra consumer spending that debt-fueled asset accumulation generated — quickly shifted into reverse, leading to a contraction in overall demand and recession.
It’s a logical story, albeit complex. It is certainly reasonable to be skeptical about a chain with this many links, especially since history is replete with bubbles and busts amidst varying degrees of inequality and income stagnation. But there is evidence to support this story of how the Great Recession came to be. For example, there is no question that reckless finance helped to inflate a housing bubble that has been extremely and lastingly costly in terms of growth, jobs, and incomes. There is also good evidence that under-regulated financial practices played an important role in these developments.
A careful analysis of the empirical implications of this cycle finds inequality growing in tandem with the increasing leverage that supported the spending of the bottom 95 percent of households in the run-up to the Great Recession.2 Then, when the bubble burst and borrowing constraints tightened, spending among this very large group flattened, helping to explain the slow recovery.
With such a complex chain of events, more evidence is warranted; however, these early analyses are convincing that an environment in which a large proportion of U.S. households is not financially healthy plays a role in some bubble/bust scenarios.
Financial Health and the Basic Growth Model
The core economic model holds that in the interest of efficient growth, an important role of society is to maximize the quality of inputs, both physical and capital, tasked with creating the outputs we want and need. This basic model makes a number of assumptions about how people and families help to spur growth. For example, at least in advanced economies, it is broadly assumed that education is recognized as an important public good — one that is optimally provided by government. It is assumed that households have some degree of geographic mobility and can respond to market signals that say “don’t stay here; go over there for better opportunities.” Finally, a lack of opportunity for upward social and economic mobility (that is, persistent poverty) constrains consumption, investments, and savings in ways that could potentially harm growth.
These assumptions in particular explain how financially healthy families contribute to macroeconomic growth and stability. Individuals boost the economy’s productivity when they get the education they need to realize their potential, when they efficiently respond to market signals (especially those relating to job opportunities), and when they consume in ways that support growth. This latter channel is particularly relevant in the American case, where consumption is 70 percent of gross domestic product (GDP), compared with 55 percent in Europe and 35 percent in China.
Conversely, financially “unhealthy” families may underconsume, undereducate their children, underinvest (e.g., due to limited access to credit), and be unable to build up the resilience they need to withstand negative shocks.
But is there evidence in support of these assumptions?
Education
Large discrepancies persist between white and minority students, as well as between high-income and low-income children, in academic achievement, dropout rates, test scores, and college completion. In addition, as the gap in income between high- and low-income families has increased, so have the achievement gaps between their children.3
More recent research has investigated how these gaps relate to family financial health. Because compared with wealthier parents, parents with fewer economic resources also have fewer key child-rearing resources — money, time, wealth, and ability to responsibly borrow. Children from less financially healthy households have less access to enrichment opportunities such as books, tutoring, computers, sports, and so on. According to consumer spending data, in the mid- 2000s, high-income families spent seven times more than low-income families on enrichment goods for their children. This compares to four times more spending during the more equitable 1970s.4 Access to quality preschool poses a similar disadvantage to low-income children: 68 percent of 3- and 4-year-old children from families making at least $75,000 a year were enrolled in preschool in 2013 compared with 49 percent from families making less than $40,000.5
Family financial health plays a well-documented role at the other end of the educational life-cycle as well: 80 percent of students born into the top income quartile between 1979 and 1982 went on to enroll in college, and 54 percent of these students completed college. In contrast, among students in the bottom income quartile, 29 percent enrolled in college, and only 9 percent eventually earned their degrees.6 Students who enter college (any postsecondary school) already teetering on the financial edge have difficulty completing school when faced with seemingly minor financial bumps such as car breakdowns or a loss of child care. Furthermore, students from families with less wealth who do go to college are increasingly saddled with debt out of proportion to their families’ wealth. Federal Reserve data in Figure 2 reveal that in 2013, the mean debt-to-income ratio was 58 percent for the bottom half of households with education debt. The same ratio for the wealthiest 5 percent of households was under 10 percent.
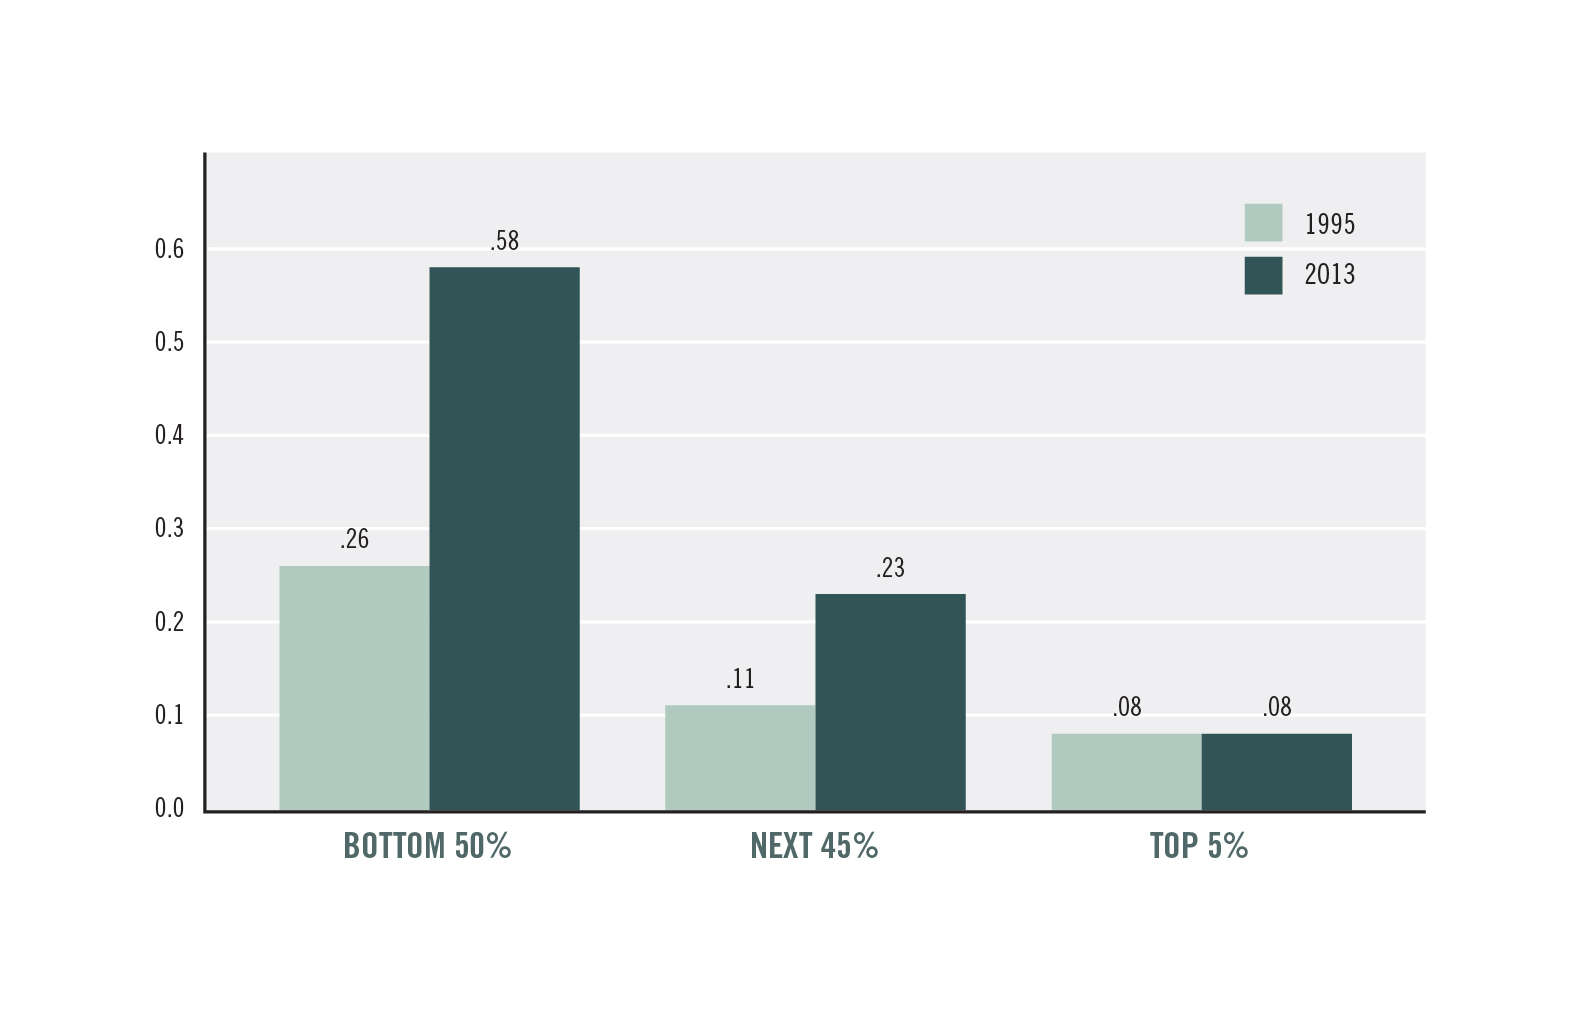
Source: Survey of Consumer Finances
Figure 2: Education Debt Has Increased for Most Americans. Ration of mean education debt to mean income (for families with education debt) by net worth group.
Both access to borrowing and concerns about their ability to service their debt burdens are deterrents to college attendance for low-income students. These debt dynamics impinge on growth in particular as lower-income students with high levels of debt are less likely to purchase homes, an activity that supports GDP growth.7
Strong and compelling evidence, already cited, reveals that poverty and inequality create barriers to educational opportunity, from preschool through college. Moreover, considerable research finds higher education is associated with greater earnings, employment, and less use of public services, all of which boost growth. Regarding macroeconomic growth, Goldin and Katz, for example, find that the direct effect of a more educated workforce explains 25 percent of U.S. productivity growth from 1915 to 2005.8 Careful econometric work has consistently found that an extra year of schooling boosts earnings by around 7 percent, and, as Table 1 reveals, wage, income, and net worth differentials between college and high school graduates are significant, with premiums for net worth ranging from 65 percent to more than 300 percent.
In other words, there is solid empirical evidence that barriers to education exist at all levels of schooling (even K-12, where underfunding in poorer communities leads to worse outcomes), that more education contributes significantly to productivity growth, and that large earnings and wealth differences exist between college and non-college-educated workers. We can thus conclude that education barriers that block children from disadvantaged families from achieving their educational potential are both a symptom of financial ill health and a negative growth factor.
Geographic Mobility and Residential Segregation
Financially healthy families are by definition mobile enough to locate in areas where conditions may be better for their families’ overall well-being. However, in recent years, residential segregation by income has significantly increased. Bischoff and Reardon find that the share of families in middle-income neighborhoods fell from 65 percent in 1970 to 42 percent in 2009. The number of families living in either poor or affluent neighborhoods, the two most extreme categories of neighborhood income, increased from 15 percent to 33 percent over these years.9
Although these facts are potentially problematic from the perspective of family well-being, does residential segregation contribute to less growth? To the extent that residential segregation affects access to education and is associated with childhood poverty, which leads to lower employment, earnings, and wealth accumulation in adulthood, then negative growth implications are certainly plausible. Reduced geographic mobility could also reduce the efficiency of job matches and thus hurt productivity growth.
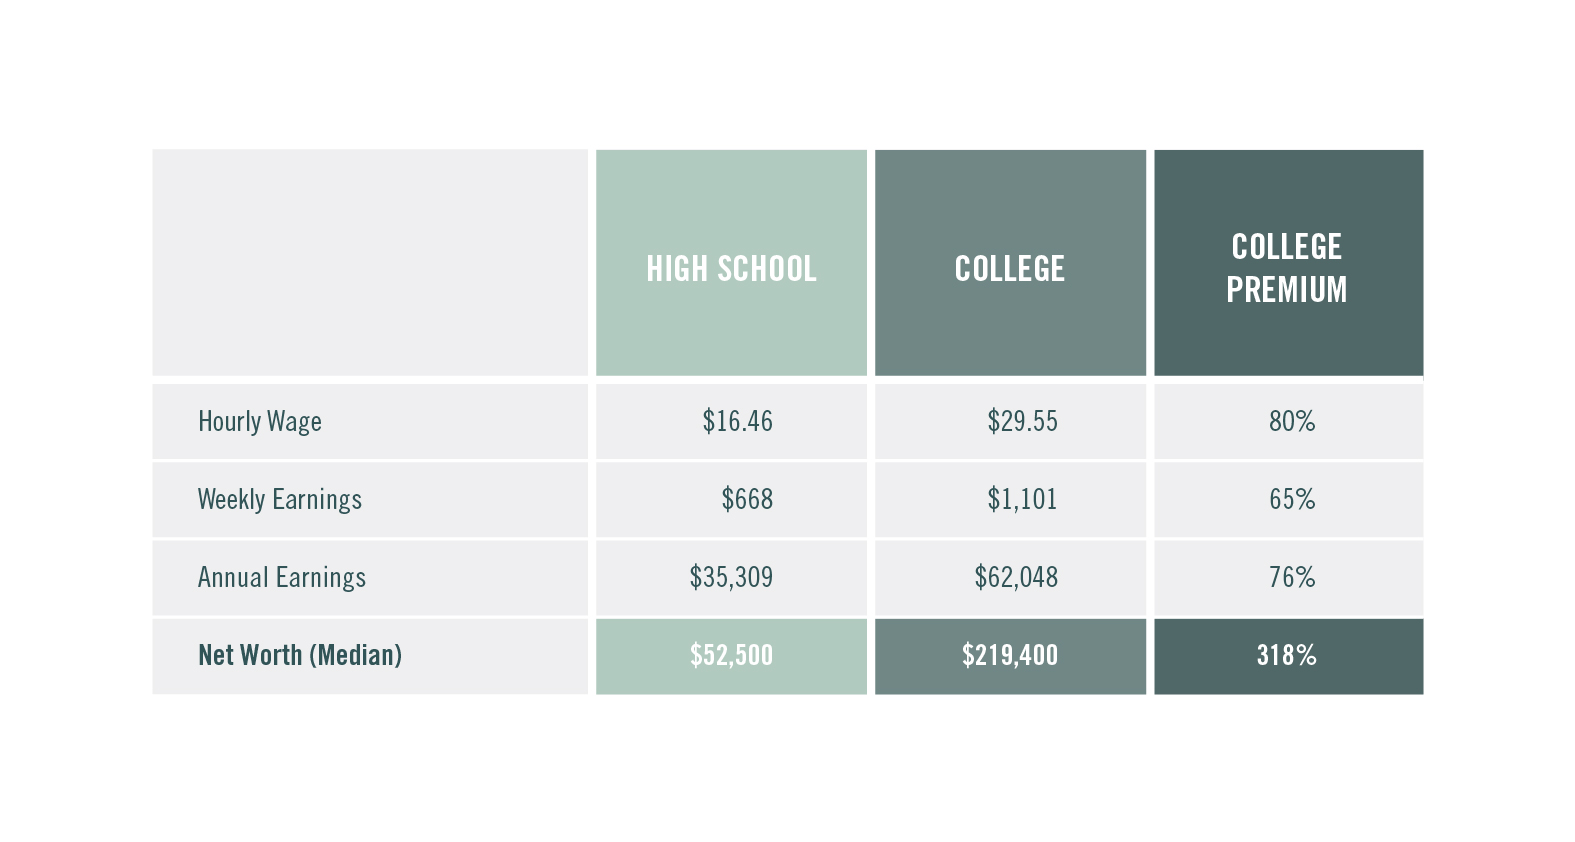
Sources: Economic Policy Institute, Bureau of Labor Statistics, U.S. Census Bureau, Federal Reserve Board.10
Table 1. Wagers, Earnings, and Net Worth by Education Level, 2013 Notes: All values for college are bachelor’s degree only except net worth, which is for a BA or higher. Weekly earnings are for full-time workers.
Recent, high-quality empirical research by Chetty and colleagues underscores these points. Their review of the Moving to Opportunity demonstration project found an increase in upward mobility when families with young children moved from high- to lower-poverty neighborhoods. When the children were younger than 13 when they moved to lower-poverty neighborhoods, their college attendance, marriage rates, and earnings rose significantly, by as much as 30 percent. Because earnings feed directly into the size of the economy, such results are associated with more growth relative to a situation where these families remained in high-poverty neighborhoods.11
Direct Effects of Financial Ill Health
There are other reasons why families facing financial difficulties because of income, wealth, or credit constraints may lack the ability to optimally consume or invest, thereby reducing growth. They may lose access to credit markets or not save enough for retirement, both of which have potentially negative growth effects. Although for some families, these are only short-term dynamics and thus do not have lasting growth implications, recent research finds that low income that persists through adulthood has generational impacts. It is certainly possible that these disadvantages add up to a constraint on macroeconomic growth. For example, children in families with persistently few economic resources can suffer lasting investment deficits, “environmental” deficits (from exposure to environmental risks such as lead to hearing fewer vocabulary words spoken at home), and high stress levels that impinge on their mobility, their future health, and future earnings. Although this may sound like the same education channel at work, it is likely more than that. The Pew Economic Mobility Project has shown that a child born into the bottom one-fifth of the income distribution who graduates from college still has only a 10 percent chance of making it to the top income quintile as an adult. In contrast, a child in the top quintile who fails to graduate college has a 25 percent chance of staying in the top one-fifth.
Insufficient access to credit that meets a family’s needs at an appropriate price can also hurt both family financial health and growth, as it can lead to reliance on overpriced alternatives that may be structured to trap the family in debt. Families stuck outside of the financial mainstream because they are unbanked or have to depend on payday lenders charging usurious rates of interest end up paying an average of $2,400 per year more than financially mainstream families. Whether these fees and rates are a distributional problem or a growth problem (or both) are beyond the data, but to the extent that they hurt the ability of low-income families to save and invest in their futures, it impinges on growth.12
Conversely, access to too much credit can also hurt growth, as it fuels the economic shampoo cycle in Figure 1. That cycle gains strength when families take on debt burdens they cannot realistically sustain, at great cost to both their own well-being, and, aggregating across significant numbers of households, to that of the broader economy.
Researchers are actively studying the channels by which financial ill health affects low-income families (see the essay in this book by Jason Purnell). “Toxic stress” — persistent exposure to stress in daily living — is more common among the poor and leaves lasting damage to parent and child health, cognition, and educational attainment, all of which can negatively impact growth.13
Research on various safety net programs, including food stamps, Medicaid, and wage subsidies to low-wage workers finds lasting impacts that could have growth implications. In a quasi-experimental study based on the gradual spread of food stamps, Hoynes and colleagues find that children who received nutritional benefits were 6 percent less likely to experience stunted growth, 5 percent less likely to experience heart disease, 16 percent less likely to experience obesity, and 18 percent more likely to graduate from high school compared with children from similar economic backgrounds who did not receive the benefits. Notably, as adults, women who had received the nutritional benefits were more likely to find work and avoid poverty.
Similarly careful studies have found similar results for Medicaid receipt (lower mortality, higher pay among women, increased college attendance, and greater tax contributions)14 and wage and income subsidies, including improved test scores for children in families receiving the benefits, along with higher employment and earnings later in life.15 Other research has found that larger wage subsidies through the Earned Income Tax Credit (EITC) led to reduced incidence of low birth weight and premature births.16 All of these are clearly pro-growth.
Although this work is rigorous and convincing at the micro level, no one has linked these benefits to macroeconomic growth, which would be very difficult, given the need to isolate such growth effects in what is today a $17 trillion economy. However, a back-of-the-envelope example may be instructive, as it at least points in the direction of greater employment and thus growth. Duncan and colleagues find that the addition of $3,000 to annual income in early childhood is associated with an added 135 hours of annual work as a young adult.17 My analysis of children in families filing for the EITC in the early 1990s (who would be young adults today) suggests that this additional income may have led to about 2 million more full-time jobs in recent years. In 2014, that could have boosted the labor force participation rate by almost 1 percentage point, and it should also be noted that faster labor force growth feeds directly into faster GDP growth. Moreover, there is no question that toxic stress, low-birth weight, obesity, diminished cognition, and other conditions related to low income generate real costs to society, and evidence that they are linked to financial ill health is compelling.
Conclusion
As noted, establishing solid empirical links between multifaceted phenomena like family financial health and macroeconomic growth is daunting. Still, numerous channels described above, from financial health to macroeconomic growth, are backed by solid empirical findings, and policy responses are warranted. For example, it is widely recognized that inadequate oversight of what turned out to be a spate of reckless financial practices in the run-up to the Great Recession played a contributing role to that very costly bubble and bust. This inadequate oversight implies the need for policy measures, such as less leverage in systemically important financial institutions and rules that enforce more prudent underwriting. I’ve also argued, with some evidence, that families’ financial ill health, a product in part of growing income inequality, played a role in the economic shampoo cycle that brought on the Great Recession.
We know that on average a person who is blocked from achieving his or her educational potential will earn less, and that, too, will deter growth, particularly if aggregated across millions of disadvantaged households. Other dimensions of poverty and residential segregation logically have the same effect.
On the other hand, financial bubbles have many causes, as do the factors that promote growth. For example, our economic history reveals bubbles and busts in periods of low inequality and robust middle-income growth. There is still no empirical link between higher inequality, diminished educational opportunity, and labor quality’s contribution to productivity growth.
My conclusion, therefore, is that there are good reasons, backed by some empirical evidence, to believe that financially unhealthy families reduce economic growth through the channels articulated above, and vice versa. Given that economic growth is a complex, multifaceted phenomenon, we cannot reliably quantify the magnitude of this relationship. But it is potentially significant, both in terms of financial volatility and squandered human capital. This is a ripe area for further research, especially as data about the long-term effects of the Great Recession become available.
Finally, even if this relationship between financial health and growth were not the case — if family financial health was unrelated to broad economic growth — there are good reasons to intervene on behalf of families and children who suffer the consequences of financial ill health. An advanced society should want to reduce barriers to opportunity based on the simple proposition that all its members should have the chance to pursue and reach their full potential.
NOTES
- Lawrence Mishel and Alyssa Davis, “Modest Income Growth in 2013 Puts Slight Dent in More than a Decade of Income Losses.” (September 16, 2014).
- Barry Cynamon and Steven Fazzari, “Inequality, the Great Recession, and Slow Recovery.” (October 24, 2014).
- Sean Reardon, “The Widening Academic Achievement Gap Between the Rich and the Poor: New Evidence and Possible Explanations.” In Whither Opportunity? Rising Inequality, Schools, and Children’s Life Chances, edited by Greg Duncan and Richard Murnane (New York: Russell Sage Foundation, 2011). Reardon finds that “the achievement gap between children from high- and low-income families is roughly 30 to 40 percent larger among children born in 2001 than among those born twenty-five years earlier.”
- Greg Duncan and Richard Murnane, “Introduction: The American Dream, Then and Now.” In Whither Opportunity? Rising Inequality, Schools, and Children’s Life Chances, edited by Greg Duncan and Richard Murnane (New York: Russell Sage Foundation, 2011).
- Author’s analysis of Census data (Current Population Survey October 2013 Detailed Tables, Table 3:Nursery and Primary School Enrollment).
- Timothy Smeeding, “Multiple Barriers to Economic Opportunity in the United States.” Paper presented at the “Inequality of Economic Opportunity” Conference at the Federal Reserve Bank of Boston, October 17–18, 2014.
- Phil Oliff et al., “Recent Deep State Higher Education Cuts May Harm Students and the Economy for Years to Come.” (Washington, DC: Center on Budget and Policy Priorities, March 19, 2013).
- Claudia Goldin and Lawrence Katz, The Race between Education and Technology (Cambridge, MA: Harvard University Press, 2008).
- Kendra Bischoff and Sean Reardon, “Residential Segregation by Income, 1970–2009.” (New York: Russell Sage Foundation, October 16, 2013).
- Elise Gould, “2014 Continues a 35-year Trend of Broad-Based Wage Stagnation.” (Washington, DC: Economic Policy Institute, February 2015); Bureau of Labor Statistics, “Usual Weekly Earnings of Wage and Salary Workers Fourth Quarter 2014.” News release (Washington, DC: Bureau of Labor Statistics, January 21, 2015); U.S. Census Bureau, Table P-22, “Educational Attainment — Workers 25 Years Old and Over by Mean Earnings and Sex: 1991 to 2013”; Jesse Bricker et al., “Changes in U.S. Family Finances from 2010 to 2013: Evidence from the Survey of Consumer Finances.” (Washington, DC: Board of Governors of the Federal Reserve System, September 2014).
- The implicit assumption here is that such higher earnings are not “rents” as used in the economic sense (i.e., they are not zero-sum), and thus represent added growth.
- Office of the Inspector General, “Providing Non-Bank Financial Services for the Underserved.” (Washington, DC: U.S. Postal Service, January 2014).
- For example, Aizer, Stroud, and Buka found that children born during times of high maternal stress ended up with “a year less schooling, a verbal IQ score that [was] five points lower and a 48 percent increase in the number of chronic [health] conditions” when compared with siblings who were born during less stressful times. Anna Aizer, Laura Stroud, and Stephen Buka, “Maternal Stress and Child Outcomes: Evidence from Siblings.” (Washington, DC: National Bureau of Economic Research, September 2012).
- Matt Broaddus, “Medicaid-eligible Children Grow Up to Earn More and Pay More in Taxes.” (Washington, DC: Center on Budget and Policy Priorities, January 21, 2015).
- Chuck Marr, Chye-Ching Huang, Arloc Sherman, and Brandon Debot, “EITC and Child Tax Credit Promote Work, Reduce Poverty, and Support Children’s Development, Research Finds.” (Washington, DC: Center on Budget and Policy Priorities, April 3, 2015).
- Arloc Sherman, Danilo Trisi, and Sharon Parrot also review all of these results in “Various Supports for Low-Income Families Reduce Poverty and Have Long-Term Positive Effects on Families and Children.” (Washington, DC: Center on Budget and Policy Priorities, July 30, 2013).
- Greg Duncan, Kathleen Zio-Guest, and Ariel Kalil, “Early-Childhood Poverty and Adult Attainment, Behavior, and Health,” Child Development 81 (1) (2010): 306–325.
About the Author

Jared Bernstein
Center on Budget and Policy Priorities
Jared Bernstein has been a Senior Fellow at the Center on Budget and Policy Priorities since May 2011. From 2009 to 2011, Bernstein was the Chief Economist to Vice President Joe Biden and a member of President Obama’s economics team. In addition to hosting On The Economy at jaredbernsteinblog.com, Bernstein has written several books—including The… Read more